Q & ESR Explained
One of the most important parameters in evaluating a high frequency chip capacitor is the Q factor, or the related equivalent series resistance (ESR). In addition to providing excellent performing RF components, JTI strives to provide our customers with accurate and complete data. Towards this end, a more detailed discussion of Q & ESR measurement issues follows.
In theory, a "perfect" capacitor would exhibit an ESR of 0 (zero) ohms and would be purely reactive with no real (resistive) component. The current going through the capacitor would lead the voltage across the capacitor by exactly 90 degrees at all frequencies.
In real world usage, no capacitor is perfect, and will always exhibit some finite amount of ESR. The ESR varies with frequency for a given capacitor, and is "equivalent" because its source is from the characteristics of the conducting electrode structures and in the insulating dielectric structure. For the purpose of modeling, the ESR is represented as a single series parasitic element. In past decades, all capacitor parameters were measured at a standard of 1 MHz, but in today’s high frequency world, this is far from sufficient. Typical values for a good high frequency capacitor of a given value could run in the order of about 0.05 ohms at 200 MHz, 0.11 ohms at 900 MHz, and 0.14 ohms at 2000 MHz.
The quality factor Q, is a dimensionless number that is equal to the capacitor’s reactance divided by the capacitor’s parasitic resistance (ESR). The value of Q changes greatly with frequency as both reactance and resistance change with frequency. The reactance of a capacitor changes tremendously with frequency or with the capacitance value, and therefore the Q value could vary by a great amount. See Equations 1 and 2.

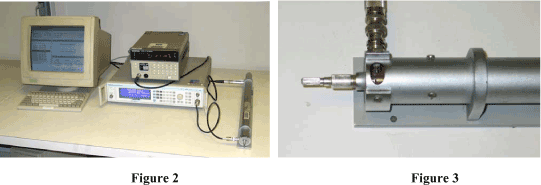
Johanson Technology measures ESR and Q on a Boonton 34A resonant line. The capacitor under test is resonated with an inductive line of an accurately characterized impedance and Q. From the resultant data (the center frequency and bandwidth of the resulting peak), the Q, ESR, and capacitance value of the device is output. This method is a long-standing industry standard for the measurement of Q and ESR at RF frequencies. Since this method depends on the frequency accuracy of a signal generator (which can be measured with extreme precision), the data taken in this manner is quite accurate. As the ESR of modern capacitors goes ever lower, the accuracy, even of this method, will approach +/- 10% (reference Boonton 34A Instruction Manual, page 2.2). This is still the most accurate method for measuring Q and ESR at RF frequencies presently available. See Figure 1 for a block diagram of the test set-up. See Figures 2 & 3 for pictures of the setup.

Using S-Parameter data collected from a Vector Network Analyzer to derive ESR is not acceptable. The predominant reason is that the accuracy of this data is limited by the accuracy of the network analyzer in a 50 ohm system (a typical amplitude calibration of ± .05 dB is not accurate enough in the low-loss region of a capacitor which could be .01 dB). Using Q / ESR data collected from an LCR meter is also not acceptable for these high-Q devices. When the device Q is very high, the LCR meter just cannot resolve an extremely small resistance (R) against an extremly large reactance (X). For this reason, ESR and Q parameters presented in Johanson Technology’s published catalog, and in the MLCSoft® program are based on the industry standard resonant line test method.

Additional Resources:
Understanding Chip Capacitors: Use this technical booklet to learn about Q factor, ESR, and RF capacitor behavior, plus how precise measurements impact RF and microwave circuit designs.